
| Symbol | Exchange | Inception Date | CUSIP | Indicative Value | Options |
|---|---|---|---|---|---|
| HDGE | NYSE Arca | 1/26/2011 | 00768Y 412 | HDGE.IV | Available |
<strong>About The ETF</strong>
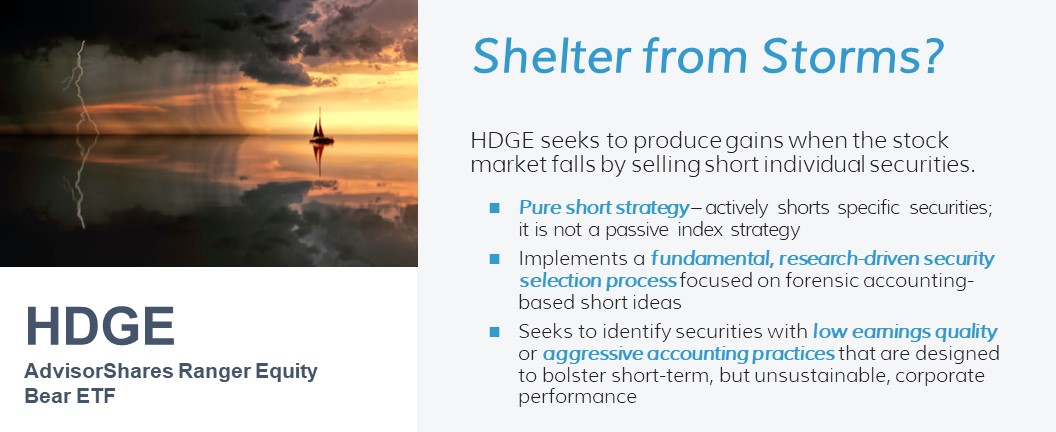
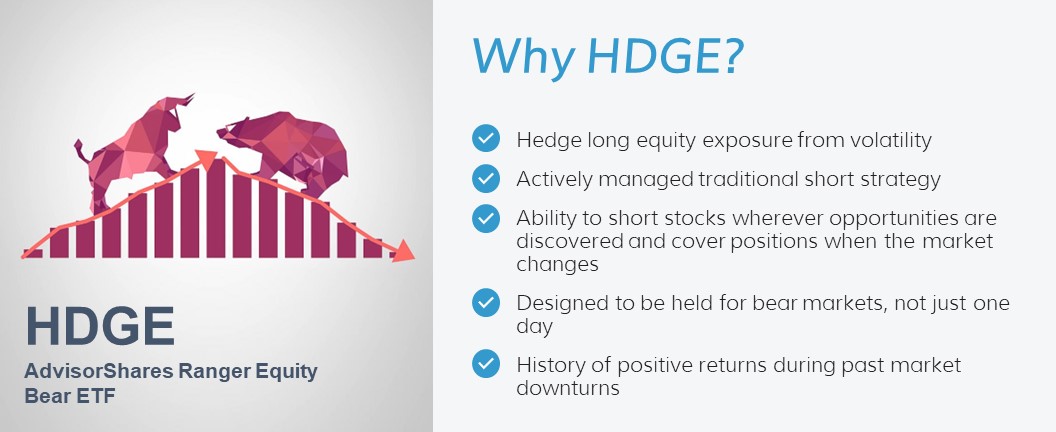
<strong>Why Invest in HDGE?</strong>
- As a Tool to Hedge Equity Exposure – HDGE can be used as part of a long/short strategy in which an investor may synthetically integrate by pairing HDGE with a long-index ETF (or an investor’s portfolio of long positions), providing the investor with a “buy and hold” option to hedge their long domestically-traded equity exposure.
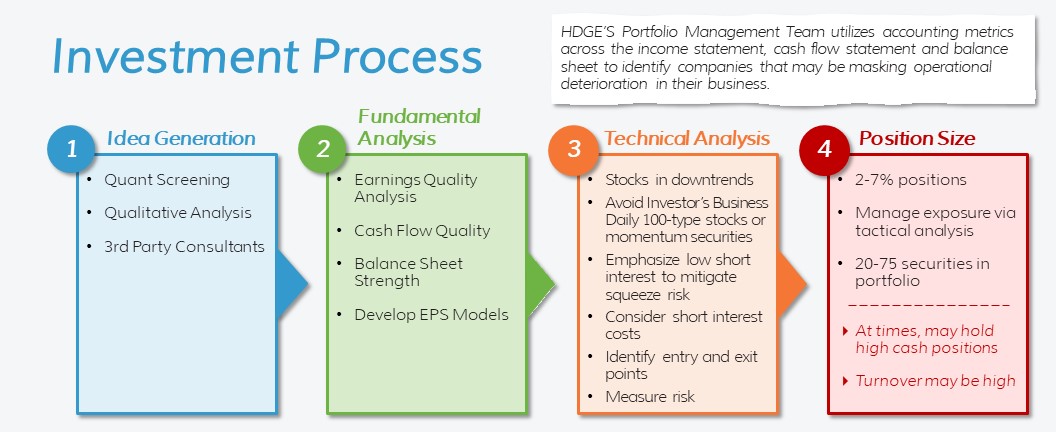
- For Diversified Portfolio Construction – The Portfolio Manager’s portfolio construction process emphasizes diversification across a number of industries and specific companies with a special focus on catalysts that drive lower stock returns. The portfolio typically consists of between 20-75 equity short positions, with an average position size of between 2% and 7% of the portfolio exposure.
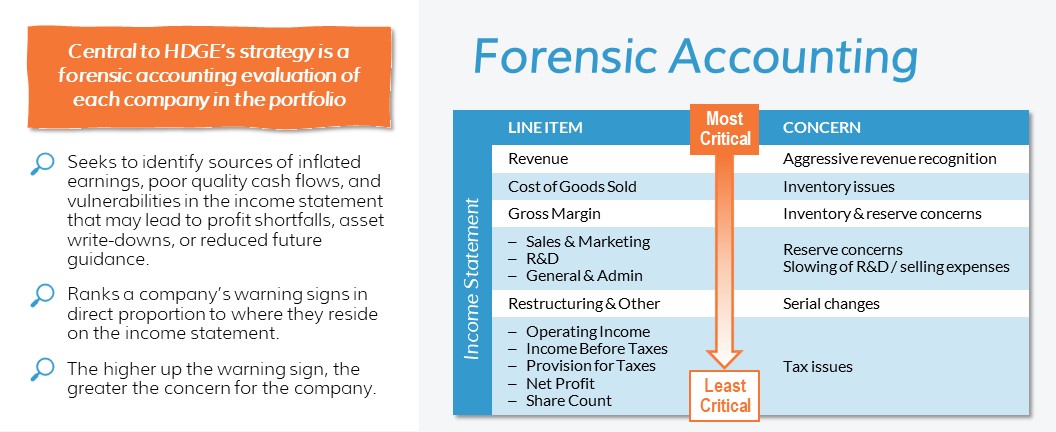
- For a Fundamental Investment Process – The Portfolio Manager utilizes accounting metrics across the income statement, cash flow statement and balance sheet to identify companies with low earnings quality or possible aggressive accounting practices. These factors may suggest operational deterioration in a company’s business. Qualitative analysis is also considered. An assessment of the management team, accounting practices, corporate governance and the company’s competitive advantage are analyzed before a company is included as part of the HDGE portfolio.
<strong>Key Attributes</strong>
- Disciplined, Repeatable Investment Process – The forensic accounting based methodology the Portfolio Manager utilizes is a disciplined, consistent investment approach to both security selection and risk management. Like an investigative auditor, a forensic accountant dissects a company’s financial statements, crunching the numbers searching for evidence in the data that may suggest operational deterioration or manipulative sales and revenue recognition, rather than focusing on fad products or broken business models to identify domestically-traded equity stocks that are expected to underperform.
- Experience – The Portfolio Manager has experience trading and managing short portfolios with the ability to tactically allocate to liquid, low short interest stocks of companies which may be masking operational deterioration.
- Market Analysis – Top-down technical evaluation of broader market liquidity, sentiment and breadth is utilized to help identify short and intermediate term market trends, manage exposure and mitigate risk.
- Specialized Strategy – Effectively shorting individual securities requires an approach very different from a traditional long-only strategy. HDGE is a very specialized product managed by investment professionals with years of short selling experience as opposed to another fund that might not have the HDGE ETF Product Manager’s shorting expertise.
<strong>About the Portfolio Manager</strong>
Mr. Del Vecchio serves as a Portfolio Manager for Ranger Alternative Management, L.P. (“Ranger”). Mr. Del Vecchio managed short only portfolios for Ranger from October, 2007 through March, 2010. He also serves as principal and founder of Parabolix Research, LLC, a short-only research firm. From 2003-2007, Mr. Del Vecchio served as an Analyst with David W. Tice & Associates / Behind the Numbers, LLC selecting short sale opportunities utilizing forensic accounting research on behalf of institutional clients and the Prudent Bear Fund. In 2002, Mr. Del Vecchio served as a portfolio manager for RedHawk Advisors, LLC with responsibility for managing the short sale allocation of the fund. In 2001, Mr. Del Vecchio served as an Analyst for the Center for Financial Research and Analysis (CFRA) performing forensic accounting analysis for short sale opportunities. Mr. Del Vecchio earned a B.S. in Finance, Summa Cum Laude, from Bryant College, and was awarded Beta Gamma Sigma honors. Mr. Del Vecchio earned the right to use the Chartered Financial Analyst designation in September, 2001.
Brad H. Lamensdorf – Portfolio Manager/ Principal
Mr. Lamensdorf serves as a Portfolio Manager for Ranger Alternative Management, L.P. (“Ranger”) and provides trading and market strategy for Ranger’s short only portfolio. Mr. Lamensdorf has served as a Trading and Market Strategist for Ranger since 2009. Mr. Lamensdorf also serves as a principal of Precisian GP, LLC and Portfolio Manager of Precisian Partners L.P., both positions of which he has held since November 2007. Prior to Precisian, Mr. Lamensdorf founded BHL Partners L.P. a commodity oriented hedge fund primarily focused on gold and gold equities. From 1998 through 2005, Mr. Lamensdorf served as principal and portfolio manager for Tarpon Capital Management, L.P., which managed long/short hedge funds. In 1997, he was a founder, partner and co-manager of KBH, L.L.P., an investment firm created to manage investment portfolios for the King-Hughes family. From 1992 through 1996, Mr. Lamensdorf worked on the equity trading desk for the Bass family in Fort Worth, Texas, where he co-managed an extensive equity portfolio with emphasis on short selling and derivatives strategies. He also provided market analysis for fund managers throughout the Bass network. Mr. Lamensdorf received a B.A. in psychology from the University of Texas at Austin in 1992.
Fund
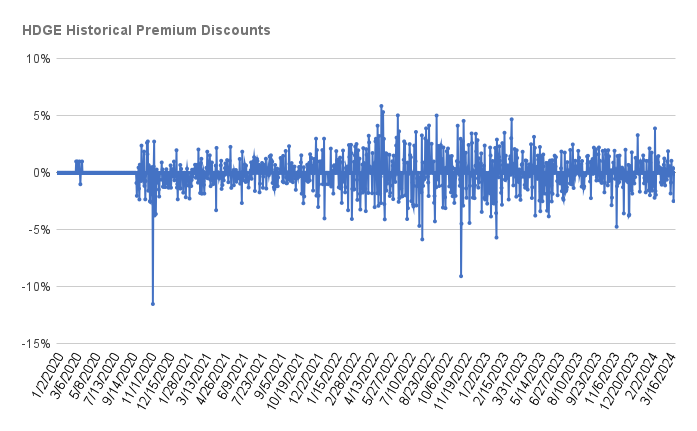
Price History
Fund Data
5/14/2024| NAV | $20.22 |
| Change | $-0.33 |
| Shares Outstanding | 3,507,500 |
| Assets Under Management | $70,915,813.37 |
Market Data
5/14/2024| Closing Price | $20.20 |
| Close Change | $-0.31 |
| Volume | 36,905 |
Regulatory Data
5/14/2024| Premium Discount | $0.04 |
| 30-Day Median bid-ask Spread | 20.26 |
Shares are bought and sold at market price (closing price) not NAV and are not individually redeemed from the Fund. Market price returns are based on the midpoint of the bid/ask spread at 4:00 pm Eastern Time (when NAV is normally determined), and do not represent the return you would receive if you traded at other times.

FUND
Characteristics
As of 4/30/2024
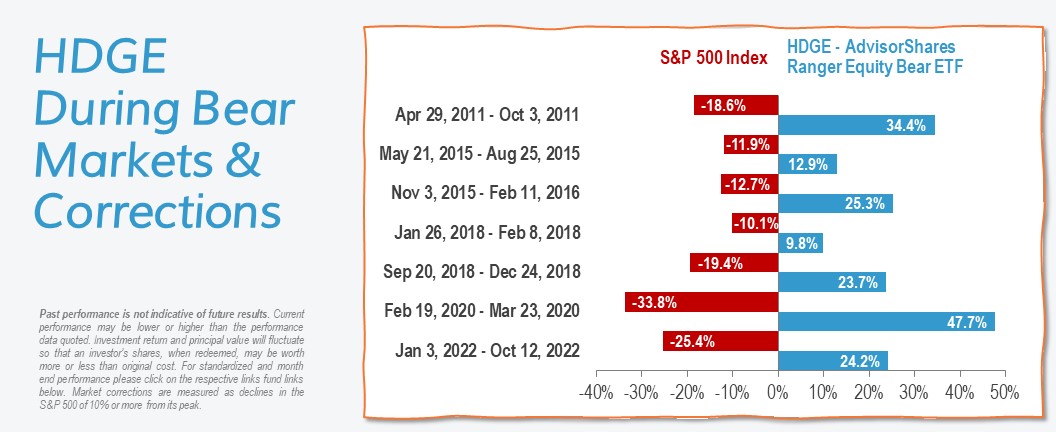
HDGE Performance During Market Drawdowns
HDGE Market Cap
HDGE Sector Allocation
FUND
Performance
As of 4/30/2024
| NAV | Market Price Return | S&P 500 Index | |
|---|---|---|---|
| 1 Month | 8.96 | 8.54 | -4.08 |
| 3 Months | 4.66 | 4.6 | 4.29 |
| YTD | 11.68 | 11.48 | 6.04 |
| 1 Year | -9.23 | -9.32 | 22.66 |
| 3 Years | -0.98 | -1.05 | 8.06 |
| 5 Years | -18.23 | -18.24 | 13.19 |
| 10 Years | -15.66 | -15.68 | 12.41 |
| Since Inception (1/26/2011, Annualized) | -16.34 | -16.35 | 12.94 |
As of 3/31/2024
| NAV | Market Price Return | S&P 500 Index | |
|---|---|---|---|
| 1 Month | -1.25 | -1.2 | 3.22 |
| 3 Months | 2.5 | 2.71 | 10.56 |
| YTD | 2.5 | 2.71 | 10.56 |
| 1 Year | -15.45 | -15.5 | 29.88 |
| 3 Years | -5.34 | -5.22 | 11.49 |
| 5 Years | -20.63 | -20.58 | 15.05 |
| 10 Years | -16.28 | -16.26 | 12.96 |
| Since Inception (1/26/2011, Annualized) | -16.97 | -16.96 | 13.38 |
Performance data quoted represents past performance and is no guarantee of future results. All Fund data and performance data quoted is believed to be accurate, and unless otherwise stated, is sourced from the Fund administrator, the Advisor’s or Sub-Advisor’s proprietary data, and Morningstar. Current performance may be lower or higher than the performance data quoted. Investment return and principal value will fluctuate so that an investor’s shares, when redeemed, may be worth more or less than original cost. Returns less than one year are not annualized.
| Date | Account Symbol | Stock Ticker | Security ID | Security Description | Shares | Share Price | Market Value | Portfolio Weight | Asset Group |
|---|---|---|---|---|---|---|---|---|---|
| 05/14/2024 | HDGE | NOV | 62955J103 | NOV INC | -90,000 | 18.9 | -1,701,000.00 | -2.40% | S |
| DEO | 25243Q205 | DIAGEO PLC-SPONSORED ADR | -11,000 | 143.64 | -1,580,040.00 | -2.23% | FS | ||
| KMX | 143130102 | CARMAX INC | -20,000 | 75.76 | -1,515,200.00 | -2.14% | S | ||
| O | 756109104 | REALTY INCOME CORP | -27,000 | 54.87 | -1,481,490.00 | -2.09% | S | ||
| RIVN | 76954A103 | RIVIAN AUTOMOTIVE INC-A | -110,000 | 11.19 | -1,230,900.00 | -1.74% | S | ||
| PUK | 74435K204 | PRUDENTIAL PLC-ADR | -60,000 | 20.13 | -1,207,800.00 | -1.70% | FS | ||
| HUM | 444859102 | HUMANA INC | -3,500 | 344.5 | -1,205,750.00 | -1.70% | S | ||
| HELE | G4388N106 | HELEN OF TROY LTD | -11,000 | 109.21 | -1,201,310.00 | -1.69% | FS | ||
| GLBE | M5216V106 | GLOBAL-E ONLINE LTD | -40,000 | 29.81 | -1,192,400.00 | -1.68% | FS | ||
| TDY | 879360105 | TELEDYNE TECHNOLOGIES INC | -3,000 | 396 | -1,188,000.00 | -1.68% | S | ||
| ALGT | 01748X102 | ALLEGIANT TRAVEL CO | -20,000 | 58.68 | -1,173,600.00 | -1.65% | S | ||
| SNDR | 80689H102 | SCHNEIDER NATIONAL INC-CL B | -52,000 | 22.43 | -1,166,360.00 | -1.64% | S | ||
| MRCY | 589378108 | MERCURY SYSTEMS INC | -40,000 | 28.93 | -1,157,200.00 | -1.63% | S | ||
| CAR | 053774105 | AVIS BUDGET GROUP INC | -9,000 | 127.91 | -1,151,190.00 | -1.62% | S | ||
| RKLB | 773122106 | ROCKET LAB USA INC | -250,000 | 4.56 | -1,140,000.00 | -1.61% | S | ||
| BE | 093712107 | BLOOM ENERGY CORP- A | -90,000 | 12.48 | -1,123,200.00 | -1.58% | S | ||
| TGNA | 87901J105 | TEGNA INC | -70,000 | 15.72 | -1,100,400.00 | -1.55% | S | ||
| ON | 682189105 | ON SEMICONDUCTOR | -15,000 | 72.99 | -1,094,850.00 | -1.54% | S | ||
| KSS | 500255104 | KOHLS CORP | -40,000 | 26.73 | -1,069,200.00 | -1.51% | S | ||
| BILL | 090043100 | BILL HOLDINGS INC | -18,000 | 58.71 | -1,056,780.00 | -1.49% | S | ||
| DAN | 235825205 | DANA INC | -75,000 | 13.93 | -1,044,750.00 | -1.47% | S | ||
| VYX | 62886E108 | NCR VOYIX CORP | -80,000 | 13.01 | -1,040,800.00 | -1.47% | S | ||
| FVRR | M4R82T106 | FIVERR INTERNATIONAL LTD | -40,000 | 25.96 | -1,038,400.00 | -1.46% | FS | ||
| CSIQ | 136635109 | CANADIAN SOLAR INC | -60,000 | 17.27 | -1,036,200.00 | -1.46% | FS | ||
| THS | 89469A104 | TREEHOUSE FOODS INC | -29,000 | 35.47 | -1,028,630.00 | -1.45% | S | ||
| SMAR | 83200N103 | SMARTSHEET INC-CLASS A | -25,000 | 40.87 | -1,021,750.00 | -1.44% | S | ||
| REG | 758849103 | REGENCY CENTERS CORP | -17,000 | 59.75 | -1,015,750.00 | -1.43% | S | ||
| LGIH | 50187T106 | LGI HOMES INC | -10,000 | 101.45 | -1,014,500.00 | -1.43% | S | ||
| GPRE | 393222104 | GREEN PLAINS INC | -50,000 | 20.24 | -1,012,000.00 | -1.43% | S | ||
| CABO | 12685J105 | CABLE ONE INC | -2,500 | 404.42 | -1,011,050.00 | -1.43% | S | ||
| MBLY | 60741F104 | MOBILEYE GLOBAL INC-A | -35,000 | 28.72 | -1,005,200.00 | -1.42% | S | ||
| APD | 009158106 | AIR PRODUCTS & CHEMICALS INC | -4,000 | 248.56 | -994,240.00 | -1.40% | S | ||
| MRTN | 573075108 | MARTEN TRANSPORT LTD | -55,000 | 18.04 | -992,200.00 | -1.40% | S | ||
| ATGE | 00737L103 | ADTALEM GLOBAL EDUCATION INC | -15,000 | 65.72 | -985,800.00 | -1.39% | S | ||
| LUV | 844741108 | SOUTHWEST AIRLINES CO | -35,000 | 28.13 | -984,550.00 | -1.39% | S | ||
| LOGI | H50430232 | LOGITECH INTERNATIONAL-REG | -11,000 | 89.17 | -980,870.00 | -1.38% | FS | ||
| RIOT | 767292105 | RIOT PLATFORMS INC | -100,000 | 9.78 | -978,000.00 | -1.38% | S | ||
| ALTM | G0508H110 | ARCADIUM LITHIUM PLC | -200,000 | 4.88 | -976,000.00 | -1.38% | FS | ||
| ELF | 26856L103 | ELF BEAUTY INC | -6,022 | 161.55 | -972,854.10 | -1.37% | S | ||
| MDB | 60937P106 | MONGODB INC | -2,700 | 359.27 | -970,029.00 | -1.37% | S | ||
| KLIC | 501242101 | KULICKE & SOFFA INDUSTRIES | -20,000 | 48.23 | -964,600.00 | -1.36% | S | ||
| SNV | 87161C501 | SYNOVUS FINANCIAL CORP | -24,128 | 39.95 | -963,913.60 | -1.36% | S | ||
| PHR | 71944F106 | PHREESIA INC | -43,000 | 22.18 | -953,740.00 | -1.34% | S | ||
| ROK | 773903109 | ROCKWELL AUTOMATION INC | -3,500 | 270.84 | -947,940.00 | -1.34% | S | ||
| ROIC | 76131N101 | RETAIL OPPORTUNITY INVESTMEN | -75,000 | 12.5 | -937,500.00 | -1.32% | S | ||
| ACI | 013091103 | ALBERTSONS COS INC - CLASS A | -45,000 | 20.8 | -936,000.00 | -1.32% | S | ||
| ROKU | 77543R102 | ROKU INC | -15,000 | 62.26 | -933,900.00 | -1.32% | S | ||
| GTLB | 37637K108 | GITLAB INC-CL A | -17,000 | 54.28 | -922,760.00 | -1.30% | S | ||
| GT | 382550101 | GOODYEAR TIRE & RUBBER CO | -70,000 | 13.07 | -914,900.00 | -1.29% | S | ||
| BBD | 059460303 | BANCO BRADESCO-ADR | -350,000 | 2.61 | -913,500.00 | -1.29% | FS | ||
| GSHD | 38267D109 | GOOSEHEAD INSURANCE INC -A | -15,000 | 60.87 | -913,050.00 | -1.29% | S | ||
| WK | 98139A105 | WORKIVA INC | -10,744 | 84.33 | -906,041.52 | -1.28% | S | ||
| NBR | G6359F137 | NABORS INDUSTRIES LTD | -12,000 | 75.24 | -902,880.00 | -1.27% | FS | ||
| INDI | 45569U101 | INDIE SEMICONDUCTOR INC-A | -150,000 | 6.01 | -901,500.00 | -1.27% | S | ||
| CCL | 143658300 | CARNIVAL CORP | -62,000 | 14.52 | -900,240.00 | -1.27% | FS | ||
| IPGP | 44980X109 | IPG PHOTONICS CORP | -10,000 | 89.76 | -897,600.00 | -1.27% | S | ||
| NTST | 64119V303 | NETSTREIT CORP | -50,000 | 17.83 | -891,500.00 | -1.26% | S | ||
| AMBA | G037AX101 | AMBARELLA INC | -19,000 | 46.2 | -877,800.00 | -1.24% | FS | ||
| HGV | 43283X105 | HILTON GRAND VACATIONS INC | -20,000 | 42.4 | -848,000.00 | -1.20% | S | ||
| CLVT | G21810109 | CLARIVATE PLC | -130,000 | 6.52 | -847,600.00 | -1.20% | FS | ||
| BC | 117043109 | BRUNSWICK CORP | -10,000 | 84.15 | -841,500.00 | -1.19% | S | ||
| SNA | 833034101 | SNAP-ON INC | -3,000 | 279.12 | -837,360.00 | -1.18% | S | ||
| PD | 69553P100 | PAGERDUTY INC | -40,000 | 20.69 | -827,600.00 | -1.17% | S | ||
| DOCS | 26622P107 | DOXIMITY INC-CLASS A | -35,000 | 23.51 | -822,850.00 | -1.16% | S | ||
| NAPA | 26414D106 | DUCKHORN PORTFOLIO INC/THE | -100,000 | 8.07 | -807,000.00 | -1.14% | S | ||
| VLY | 919794107 | VALLEY NATIONAL BANCORP | -100,000 | 8.02 | -802,000.00 | -1.13% | S | ||
| BORR | G1466R173 | BORR DRILLING LTD | -138,000 | 5.79 | -799,020.00 | -1.13% | FS | ||
| EXTR | 30226D106 | EXTREME NETWORKS INC | -70,000 | 10.64 | -744,800.00 | -1.05% | S | ||
| CZR | 12769G100 | CAESARS ENTERTAINMENT INC | -20,000 | 36.71 | -734,200.00 | -1.04% | S | ||
| ALGM | 01749D105 | ALLEGRO MICROSYSTEMS INC | -25,000 | 28.54 | -713,500.00 | -1.01% | S | ||
| APTV | G6095L109 | APTIV PLC | -7,500 | 82.84 | -621,300.00 | -0.88% | FS | ||
| APPN | 03782L101 | APPIAN CORP-A | -7,800 | 33.62 | -262,236.00 | -0.37% | S | ||
| X9USDFITY | FIDELITY INSTL GOVT 657 C | 23,926,345.7 | 1 | 23,926,345.70 | 33.74% | MM | |||
| X9USDBLFD | BLACKROCK FEDERAL FD 30 INSTL | 58,598,134.91 | 1 | 58,598,134.91 | 82.62% | MM | |||
| CASH | 60,324,990.08 | 100 | 60,324,990.08 | 85.06% | CA |
FUND
| Management Fee | 1.50% |
| Other Expenses | 1.89% |
| Acquired Fund Fees and Expenses* | 0.06% |
| Total Annual Operating Expenses | 3.45% |
*Total Annual Operating Expenses and Total Annual Operating Expenses After Waiver/Reimbursement in this fee table may not correlate to the expense ratios in the Fund’s financial highlights. For more information, please read the full prospectus.

Last Ten
Fund Distributions
- Before investing you should carefully consider the Fund’s investment objectives, risks, charges and expenses. This and other information is in the prospectus, a copy of which may be obtained by visiting the Fund’s website at www.AdvisorShares.com. Please read the prospectus carefully before you invest. Foreside Fund Services, LLC, Distributor.
- There is no guarantee that the Fund will achieve its investment objective. An investment in the Fund is subject to risk, including the possible loss of principal amount invested. The Fund may invest in (or short) ETFs, ETNs and ETPs. In addition to the risks associated with such vehicles, investments, or reference assets in the case of ETNs, lack of liquidity can result in its value being more volatile than the underlying portfolio investment. Other Fund risks include market risk, equity risk, short sales and leverage risk, large cap risk, early closing risk, liquidity risk and trading risk. Short sales involve leverage because the Fund borrows securities and then sells them, effectively leveraging its assets. The use of leverage may magnify gains or losses for the Fund. See prospectus for specific risks and details.
- Definitions
- Short: A short, or a short position, is created when a trader sells a security first with the intention of repurchasing it or covering it later at a lower price.
ETF
Social
Conversation